###############################
PCA
###############################
install.packages(“vegan”)
library(vegan)
> STpcoa<-read.table(file=”bactera_16s_final.subsample.phylip.tre1.weighted.phylip.pcoa.axes”, header=T,row.names=1)
> STpcoa
axis1 axis2 axis3 axis4
Cellulose -0.020878 -0.234601 0.167454 0
Foodwaste -0.234592 0.221741 0.085802 0
Sludge 0.368882 0.100725 -0.010570 0
Xylan -0.113413 -0.087865 -0.242686 0
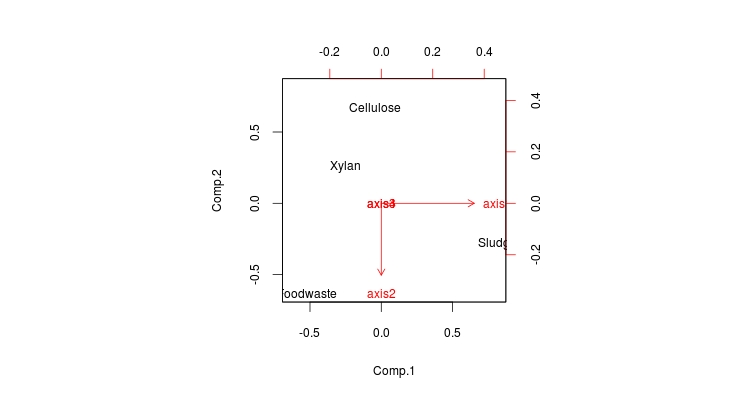
>pl.STpcoa<-princomp(STpcoa)
> summary(pl.STpcoa)
Importance of components:
Comp.1 Comp.2 Comp.3 Comp.4
Standard deviation 0.2260563 0.1746944 0.1536319 0
Proportion of Variance 0.4856521 0.2900347 0.2243133 0
Cumulative Proportion 0.4856521 0.7756867 1.0000000 1
> ls(pl.STpcoa)
[1] “call” “center” “loadings” “n.obs” “scale” “scores” “sdev”
> class(pl.STpcoa)
[1] “princomp”
> nmds.col<-c(rep(“green”, 1), rep(“blue”, 1), rep(“black”,1), rep(“red”,1))
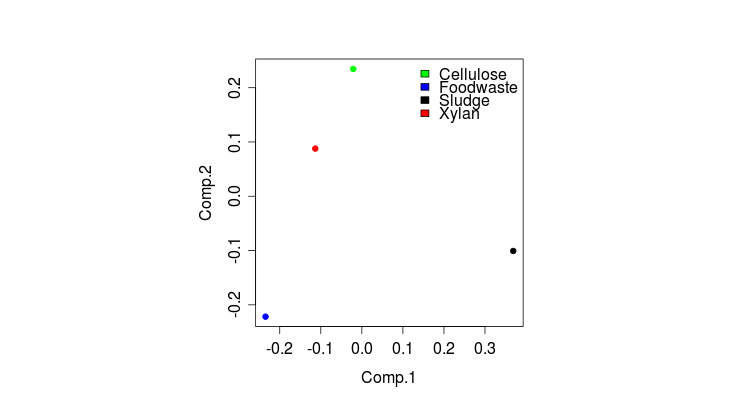
> plot(pl.STpcoa$scores, col=nmds.col, pch=20)
> legend(x=0.12, y=0.25, c(“Cellulose”,”Foodwaste”,”Sludge”,”Xylan”),c(“green”,”blue”,”black”,”red”),bty=”n”)

##############################
> pl2.STpcoa<-prcomp(STpcoa)
> class(pl2.STpcoa)
[1] “prcomp”
> pl2.STpcoa$sd^2
[1] 0.06813525 0.04069083 0.03147035 0.00000000
> summary(pl2.STpcoa)
Importance of components:
PC1 PC2 PC3 PC4
Standard deviation 0.2610 0.2017 0.1774 0
Proportion of Variance 0.4857 0.2900 0.2243 0
Cumulative Proportion 0.4857 0.7757 1.0000 1
> pl2.STpcoa$x
PC1 PC2 PC3 PC4
Cellulose -0.02087762 -0.2346017 0.16745306 0
Foodwaste -0.23459165 0.2217407 0.08580311 0
Sludge 0.36888225 0.1007250 -0.01056992 0
Xylan -0.11341297 -0.0878640 -0.24268626 0
> pl2.STpcoa$rotation
PC1 PC2 PC3 PC4
axis1 1.000000e+00 -9.352971e-08 -8.835157e-07 0
axis2 9.353330e-08 1.000000e+00 4.064575e-06 0
axis3 8.835153e-07 -4.064576e-06 1.000000e+00 0
axis4 0.000000e+00 0.000000e+00 0.000000e+00 1
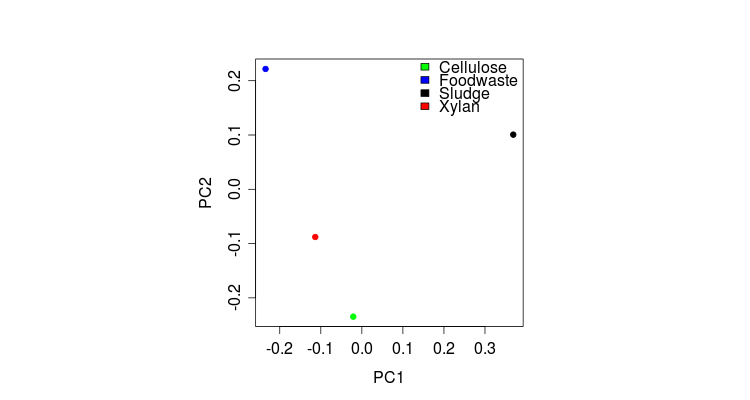
> plot(pl2.STpcoa$x, col=nmds.col, pch=20)
> legend(x=0.12, y=0.25, c(“Cellulose”,”Foodwaste”,”Sludge”,”Xylan”),c(“green”,”blue”,”black”,”red”),bty=”n”)

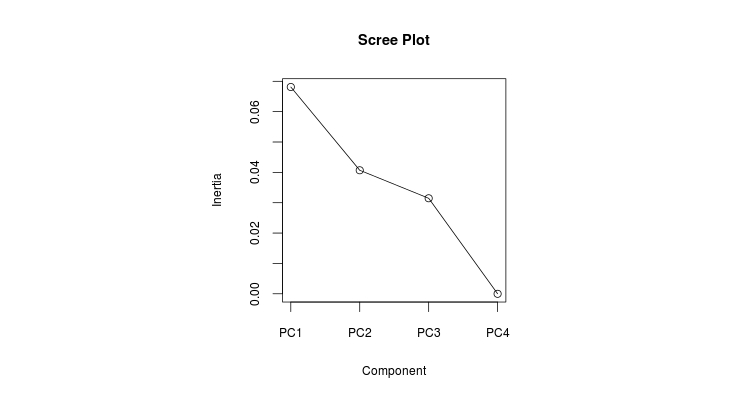
> screeplot(pl2.STpcoa,type=”lines”,main=”Scree Plot”)
 bactera_16s_final.subsample.phylip.tre1.weighted.phylip.pcoa.axes


Recent Comments