source(“http://www.bioconductor.org/biocLite.R”);
biocLite(“affy”);
biocLite(“Biobase”);
library(affy);
library(Biobase);
>bac_4sampledata=read.csv(“/home/R_heatmap/4sample_R_cluster.csv”, sep=”\t”)
> row.names(bac_4sampledata)<-bac_4sampledata$Group
> bac_4sample_Datamatrix<-data.matrix(bac_4sampledata[,2:5])
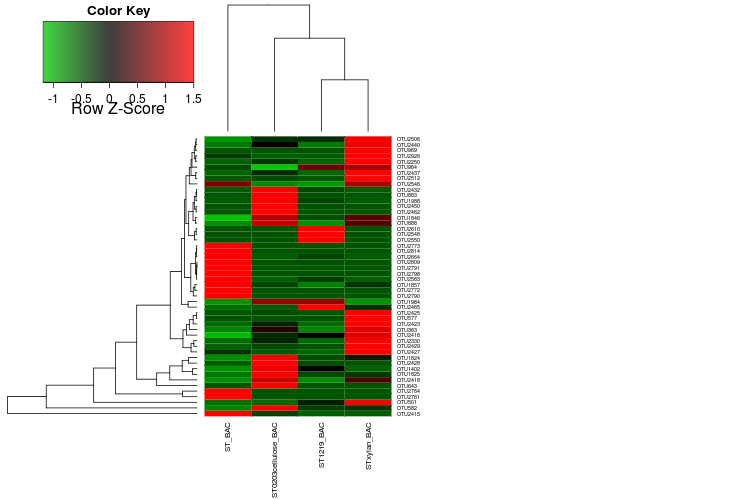
> heatmap.2(bac_4sample_Datamatrix, distfun=dist,col=greenred(256), scale=”row”, key=TRUE, symkey=FALSE, density.info=”none”, trace=”none”, cexRow=0.5, cexCol=0.7,margin=c(7,30), keysize=1.5);
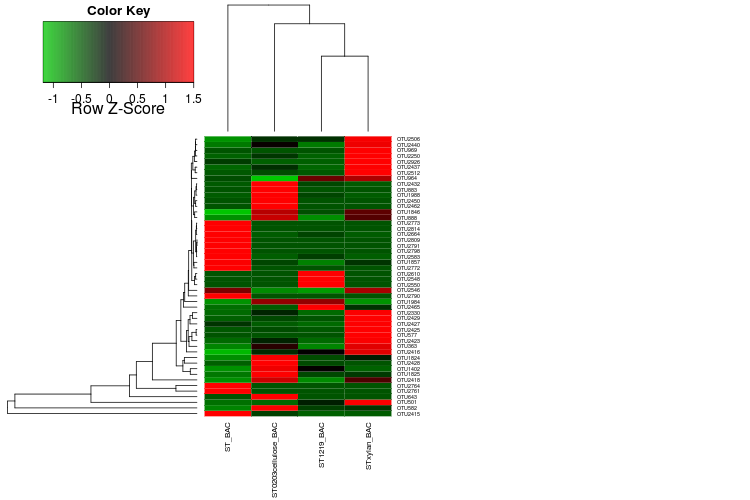
> heatmap.2(bac_4sample_Datamatrix, distfun = function(x) dist(x,method = 'euclidean'),hclustfun = function(x) hclust(x,method = 'centroid'),col=greenred(256), scale="row", key=TRUE, symkey=FALSE, density.info="none", trace="none", cexRow=0.5, cexCol=0.7,margin=c(7,30), keysize=1.5);


Recent Comments