> gtsdata_test=read.table(“gtsdata.txt”, header=T)
> gtsenv=read.table(“gtsenv.txt”, header=T)
> gtsdata_data_t<-t(gtsdata_data)
> decorana(gtsdata_data_t)
Call:
decorana(veg = gtsdata_data_t)
Detrended correspondence analysis with 26 segments.
Rescaling of axes with 4 iterations.
DCA1 DCA2 DCA3 DCA4
Eigenvalues 0.8634 0.4834 0.23788 0
Decorana values 0.8721 0.3793 0.07223 0
Axis lengths 5.3292 2.1115 1.80907 0
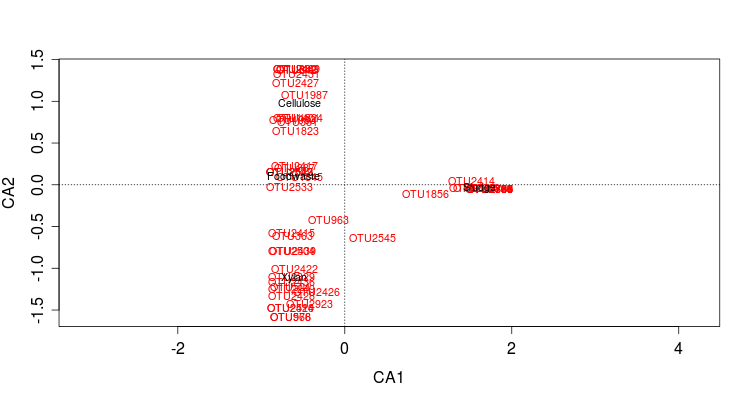
> gts.ca=cca(gtsdata_data_t)
> gts.ca
Call: cca(X = gtsdata_data_t)
Inertia Rank
Total 1.653
Unconstrained 1.653 3
Inertia is mean squared contingency coefficient
Eigenvalues for unconstrained axes:
CA1 CA2 CA3
0.8721 0.5037 0.2776
> plot(gts.ca,scaling=3)
> gtsdata_data_t_del<-gtsdata_data_t[1:3,]
> gtsdata_data_t_del
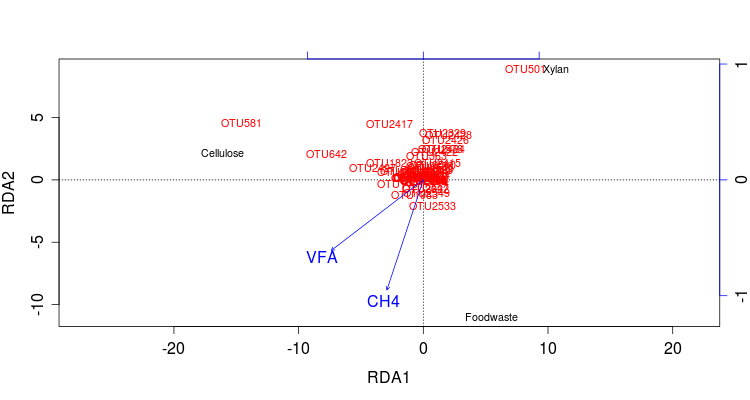
> gts.rda=rda(gtsdata_data_t_del,gtsenv)
> gts.rda
Call: rda(X = gtsdata_data_t_del, Y = gtsenv)
Inertia Proportion Rank
Total 101790 1
Constrained 101790 1 2
Unconstrained 0 0 0
Inertia is variance
Some constraints were aliased because they were collinear (redundant)
Eigenvalues for constrained axes:
RDA1 RDA2
81240 20549
plot(gts.rda,display=c(“sp”,”bp”,”si”),scaling=3)


Recent Comments