install.packages("BiodiversityR")
library(BiodiversityR)
library(vegan)
data(dune.env)
data(dune)
RankAbun.1 <- rankabundance(dune)
RankAbun.1
rankabunplot(RankAbun.1,scale='abundance', addit=FALSE, specnames=c(1,2,3))
rankabuncomp(dune, y=dune.env, factor='Management',
    scale='proportion', legend=FALSE)

mcranndata<-read.csv(file="mcra.nn.shared.csv", header=T, sep="\t")
row.names(mcranndata)<-mcranndata$Group;
mcranndata_matrix<mcranndata[,3:623]
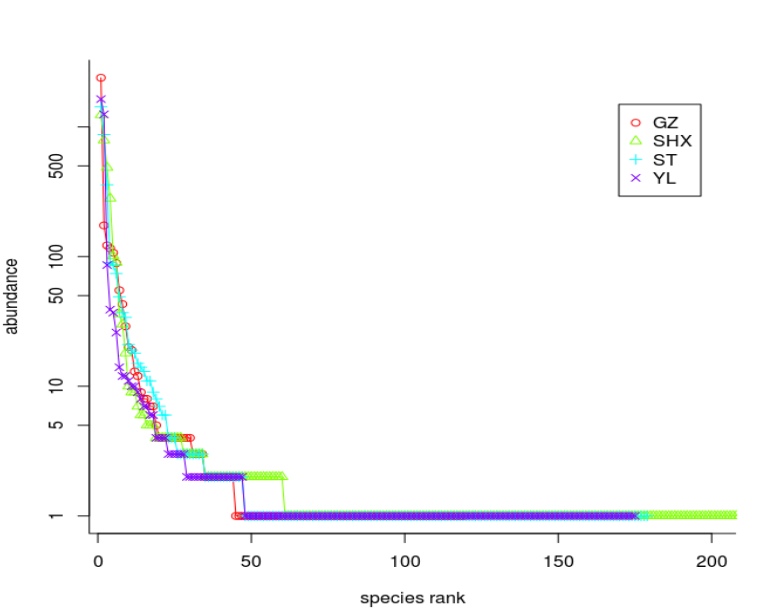
rankabuncomp(mcranndata_matrix, y=reladata, factor='Group', scale='logabun',scaledx=T, type='l', xlim=c(5,200))

Functions ‘rankabundance’ and ‘rankabuncomp’ allow to calculate
     rank abundance curves for subsets of the community and
     environmental data sets. Function ‘rankabundance’ calculates the
     rank abundance curve for the specified level of a selected
     environmental variable. Method ‘rankabuncomp’ calculates the rank
     abundance curve for all levels of a selected environmental
     variable separatedly.
 scaledx: Scale the horizontal axis to 100 percent of total number of
          species.

   scale: Method of scaling the vertical axis. Method "abundance" uses
          abundance, "proportion" uses proportional abundance (species
          abundance / total abundance), "logabun" calculates the
          logarithm of abundance using base 10 and "accumfreq"
          accumulates the proportional abundance.

mcra.nn.shared


Recent Comments